Menu Profitability Calculator
Enter your dishes — price, plate cost, and how many you sell — and see each one's contribution margin and food cost, then where it lands on the menu engineering matrix: Star, Plowhorse, Puzzle, or Dog. Nothing leaves your browser.
| Dish | Price (€) | Plate cost (€) | Units sold | |
|---|---|---|---|---|
Your menu, classified
- Signature burgerContribution: €12Food cost: 33%Share: 47%Star
- Fish & chipsContribution: €7Food cost: 56%Share: 41%Plowhorse
- RibeyeContribution: €19Food cost: 44%Share: 8%Puzzle
- Soup of the dayContribution: €4Food cost: 50%Share: 5%Dog
Plowhorse: Fish & chips — high volume, thin margin. Every cover earns less than it should — the first place to look for margin.
Compare like with like — run this one category at a time (starters against starters), since a starter and a main never compete fairly on the same grid. Thresholds are the average contribution of the dishes you enter and a 70% share benchmark.
New to this? Read the complete guide to menu engineering.
This is the 60-second version.
The full Couverté Verdict reads your real POS and menu, benchmarks your market, and hands you three prioritized moves — free.
Get your free Verdict →How to read the four quadrants
-
Star
High margin, high popularity. Protect it — hold the recipe and the position, never discount it.
-
Plowhorse
Low margin, high popularity. The dangerous favourite — nudge the price, re-spec the plate, redirect demand.
-
Puzzle
High margin, low popularity. Profitable but hidden — reposition, rename, or hand-sell it.
-
Dog
Low margin, low popularity. Usually cut — unless it's a deliberate anchor, a signature, or a dietary necessity.
The full method — costing recipes, setting thresholds, and running the loop on a weekly cadence — is in the complete guide to menu engineering, with the terms defined in the glossary.
This calculator is the free version. The full matrix lives in your Verdict.
Same four quadrants, but every dish placed automatically from your POS data, kept current every week — no manual entry required.
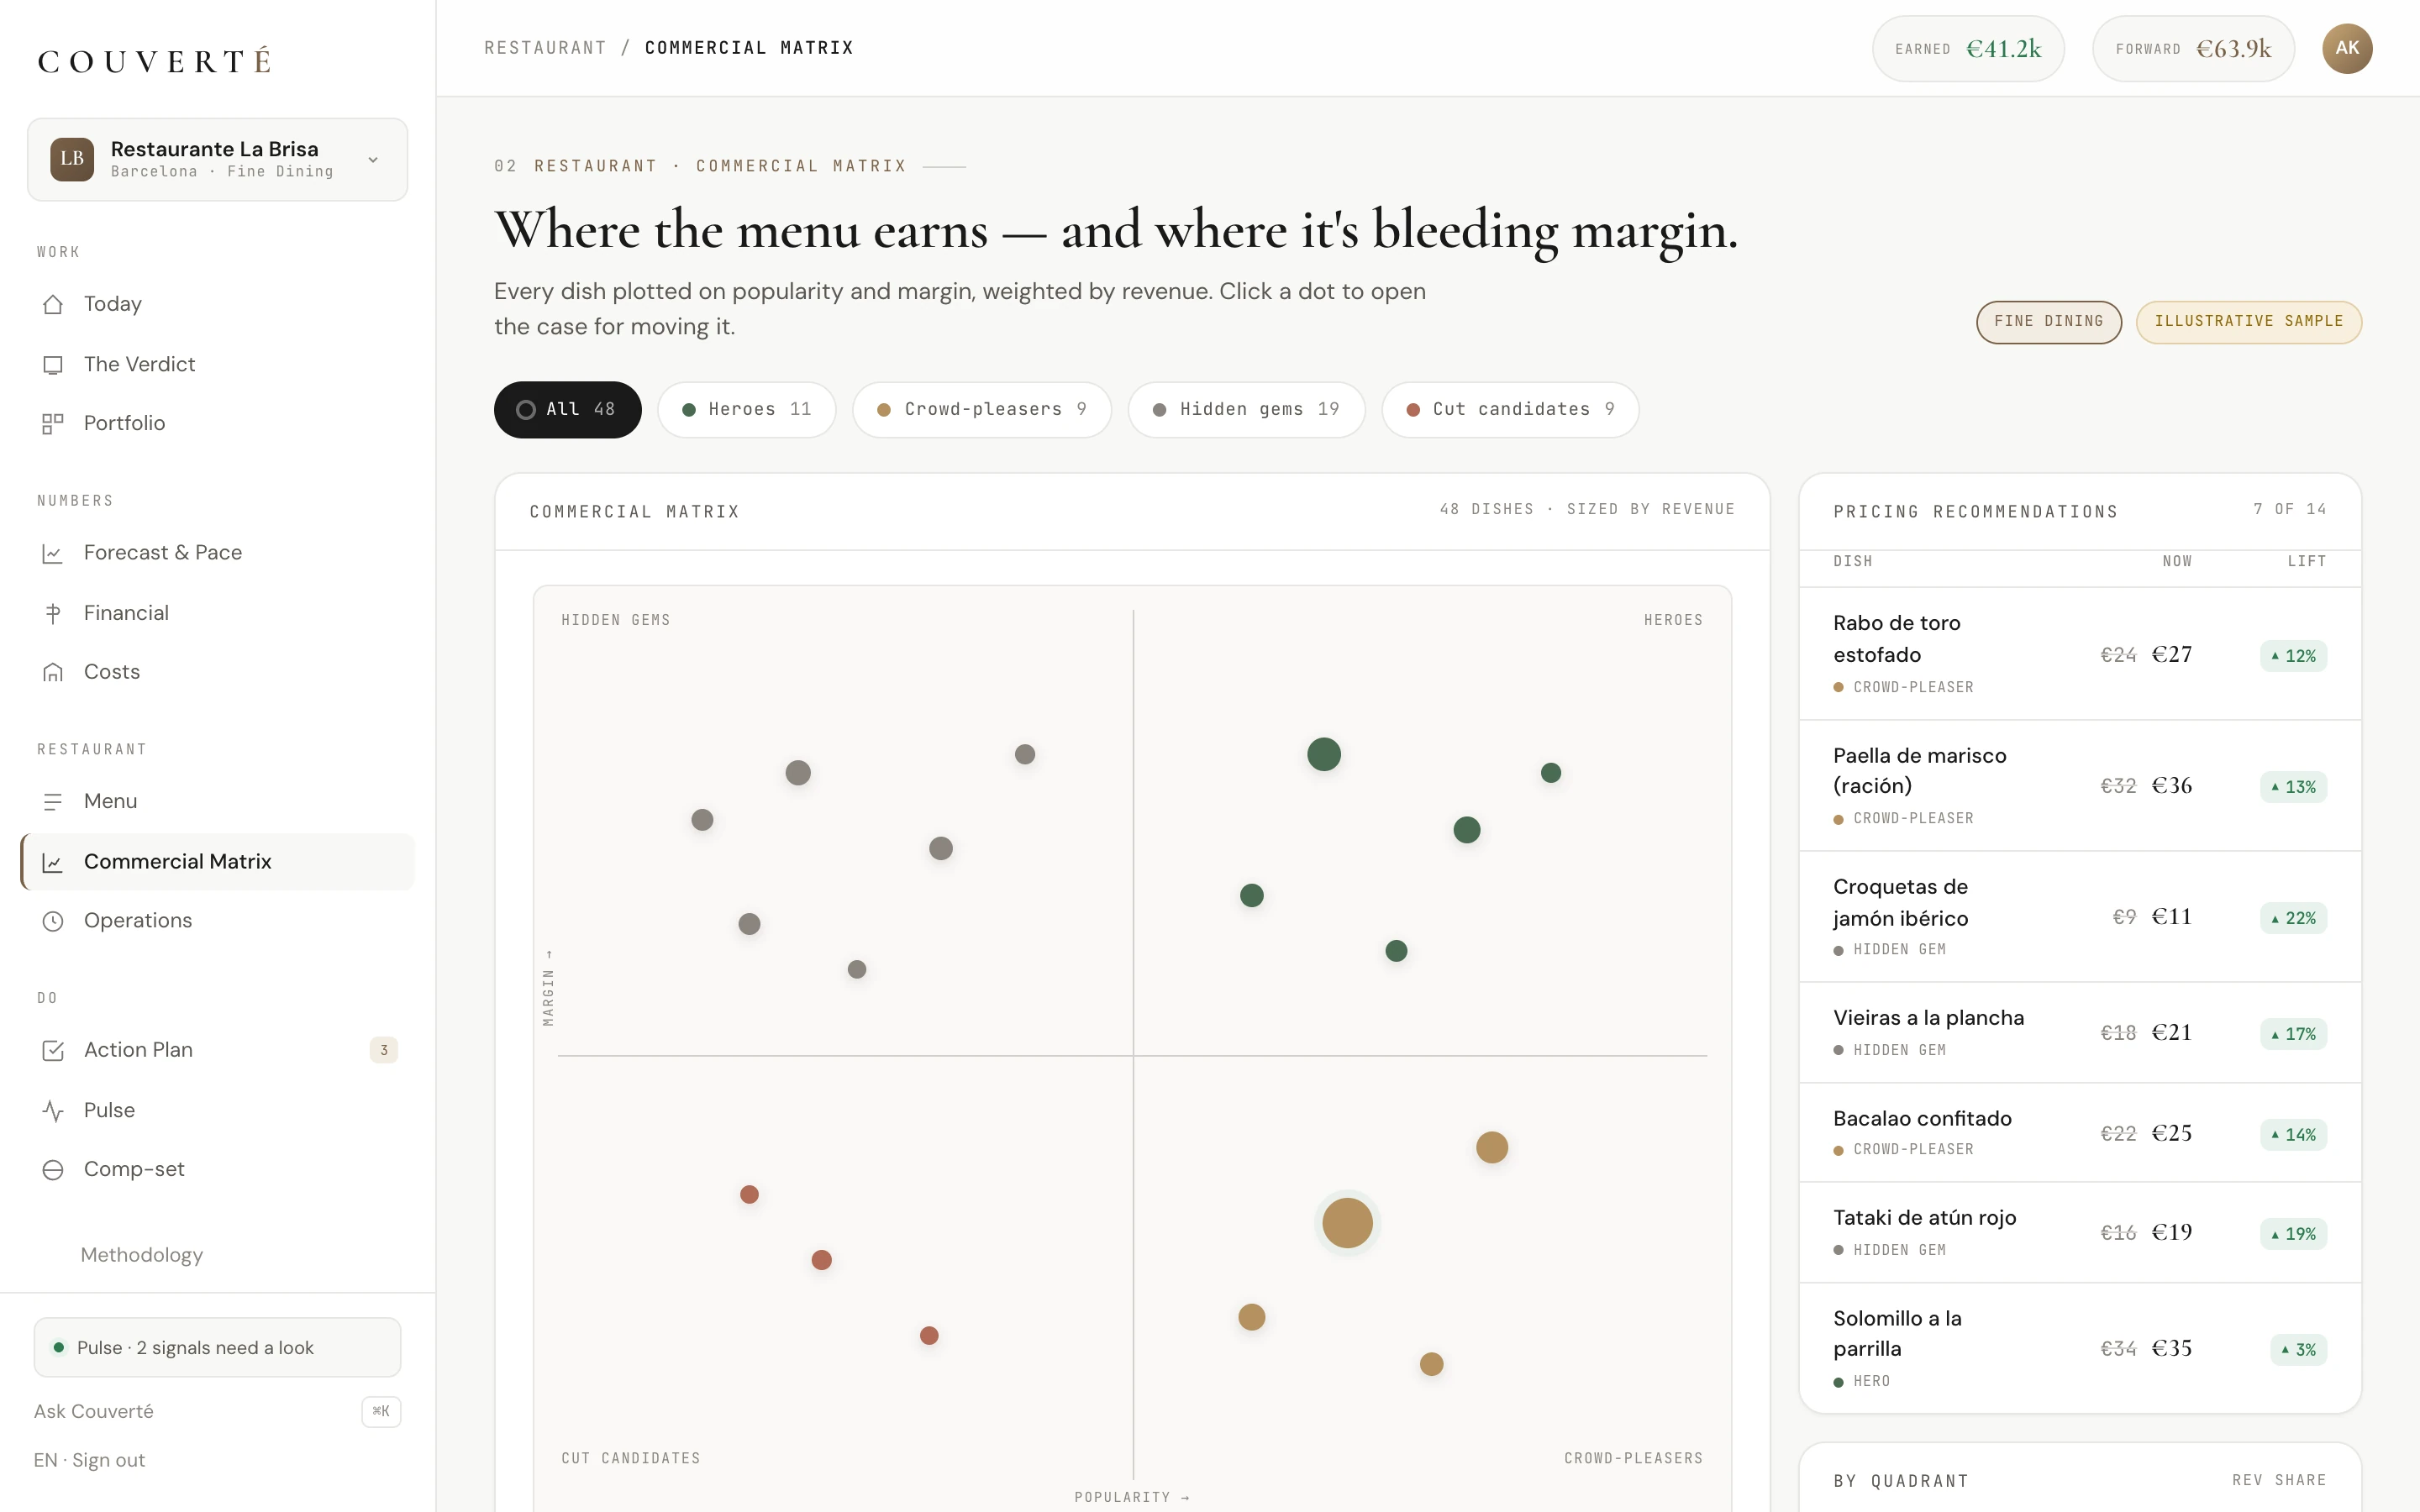
Illustrative — every Verdict is property-specific